Using Grafana
Grafana is commonly used with CGSE to visualize telemetry data stored in InfluxDB.
This page focuses on day-to-day usage: connecting Grafana to InfluxDB, creating dashboards, and understanding the data you are plotting.
For stack installation and server configuration, see Monitoring Stack Setup.
For developer details on telemetry data structure, see Monitoring and Telemetry in CGSE.
Connect Grafana to InfluxDB
After InfluxDB and Grafana are running, open Grafana in your browser:
http://localhost:3000.
In the left menu, select Connections and add a new InfluxDB connection.
Use the following settings:
Name: Any descriptive name, for exampleinfluxdb3-ariel.Query language:SQL.HTTP>URL:http://127.0.0.1:8181.Auth: Enable only Basic auth.InfluxDB Details>Database: The target InfluxDB database.InfluxDB Details>Token: Your InfluxDB token (starts withapiv3_).InfluxDB Details: Enable Insecure Connection.
Click Save and test to verify that Grafana can reach the database.
If the connection test fails, first verify the token, database name, and URL.
Create a Basic Dashboard
- Open Dashboards in the left menu.
- Create a new dashboard and add a panel.
- In the panel query, select your InfluxDB data source.
- Select the table that matches the process storage mnemonic.
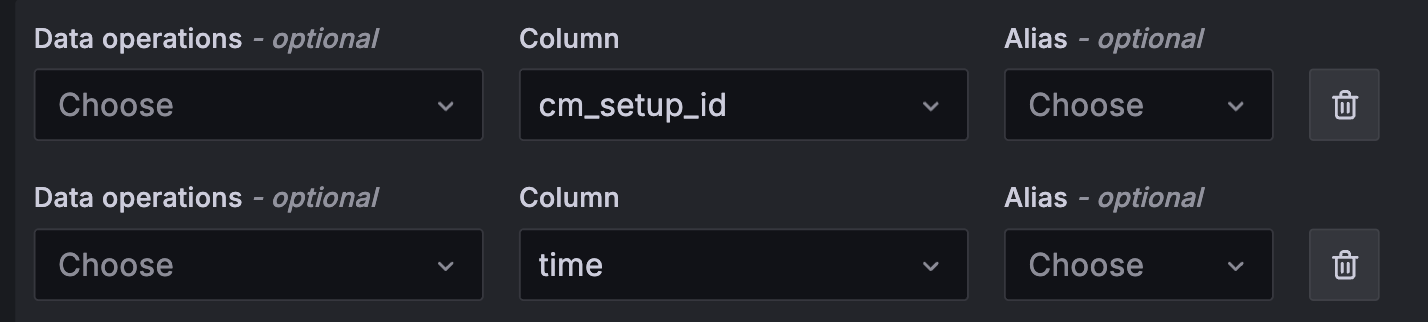
- Select the metrics you want to plot.
- Add
timein Data Operations so Grafana recognizes the timestamp column.
In CGSE, the table name usually matches the storage mnemonic of the process that produced the telemetry.
Example of the query configuration:
Troubleshooting Basics
- No data visible: verify the selected database and table name.
- Empty graph: verify that
timeis included in the query operations. - Auth errors: verify token validity and data source settings.
- Unexpected table names: check the process storage mnemonic used by the corresponding CGSE component.